Feb 14, 2024
New Berkeley Lab Report on Solar-Adopter Income and Demographic Trends
The report is based on 3.4 million residential households across the country that installed solar onsite through year-end 2022, representing 86% of all U.S. residential PV systems.
By: Galen Barbose and Sydney Forrester
Lawrence Berkeley National Laboratory has released the latest edition of its annual report, Residential Solar-Adopter Income and Demographic Trends. The report is based on address-level data for 3.4 million residential households across the country that installed solar onsite through year-end 2022, representing 86% of all U.S. residential PV systems. It describes trends in solar-adopter household income, race and ethnicity, rurality, education levels, occupation, age, home value, housing type and tenure, and prevalence within disadvantaged communities. The report also explores how characteristics of PV installations vary with household income level, including differences in the use of third-party ownership, system size, and the use of battery storage, as well variation in solar-adopter income levels across individual installers.
The report is accompanied by an online solar demographics data visualization tool that enables users to further explore the data at the national, state, county, and Census tract level.
The following are a few select findings from the latest update.
Solar-adopter incomes vary considerably, and include many low-and-moderate income households. Solar adopters come from all income groups. As shown in the left-hand panel in Figure 1, 45% of U.S. households that installed solar in 2022 had incomes below $100,000. Though not shown here, roughly 45% of 2022 adopters had incomes below 120% of their area median income (a threshold sometimes used to define low-and-moderate income or LMI), while 23% were below 80% of area median income (often used to define low-income).
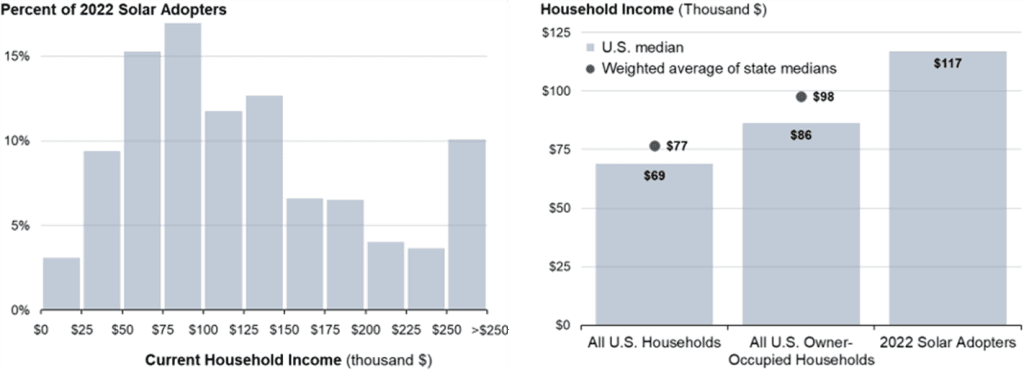
Solar-adopter incomes skew high, albeit less so if comparing to only owner-occupied homes in the same state. The median household income of 2022 solar adopters was $117,000, which is 70% higher than the median income of all U.S. households ($69,000), as shown in the right-hand panel of Figure 1. That disparity is partly due to the fact that rooftop solar is largely limited to owner-occupied homes, which tend to be higher income, and is also partly due to the concentration of the U.S. solar market in relatively high-income states, which tend to have supportive solar policies. Controlling for both of those factors, solar adopter incomes in 2022 were roughly 20% higher than the median income of owner-occupied households in the same state ($98,000).
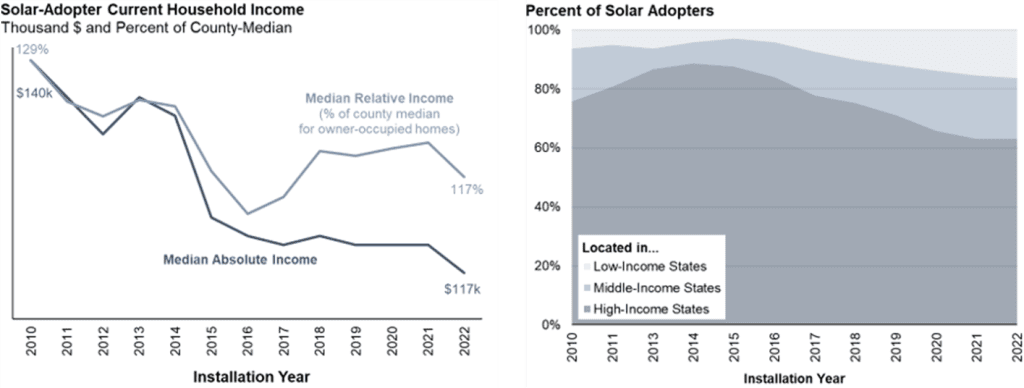
Solar adoption continues to shift toward less affluent households over time. The median income of solar adopters has fallen from $140,000 in 2010 (based on present-day incomes) to $117,000 in 2022, as shown in the left-hand panel of Figure 2. Most of that decline occurred in the first half of that period, though 2022 marked a notable drop from the year prior. This overall trend partly reflects a broadening of U.S. solar markets into lower-income states, as shown in the right-hand panel. It also reflects a deepening of solar markets, as adoption increasingly occurs among less affluent households within established markets. That latter trend is captured by the trajectory of solar-adopter relative incomes shown in the left-hand figure, which fell from 129% of their respective county-median incomes in 2010 to 117% in 2022.
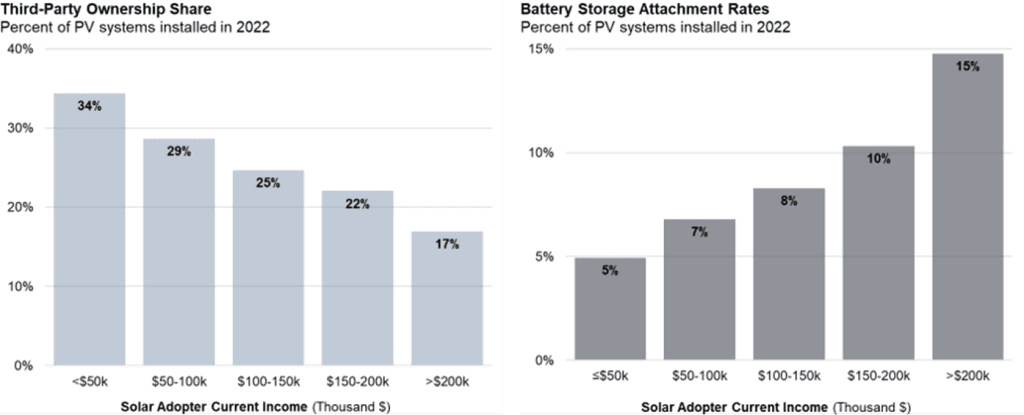
PV systems installed by less affluent households are more likely to be third-party owned. Third-party ownership (TPO) through leases or power purchase agreements is one way to address up-front cost barriers to PV adoption. As shown in the left-hand panel of Figure 3, TPO shares are consistently higher for progressively lower-income households: roughly double the rate for households in the lowest vs. the highest income group in 2022 (34% vs. 17%).
PV systems installed by less affluent households are less likely to include battery storage. Customers are increasingly installing battery storage along with PV systems, which can provide greater utility bill savings and enhanced resilience, albeit with some additional cost. As shown in the right-hand pane of Figure 3, battery storage attachment rates (the percentage of new PV systems co-installed with storage) were consistently lower for less-affluent households in 2022: for the lowest income group, they were roughly one-third the rate of the highest income group (5% vs. 15%).
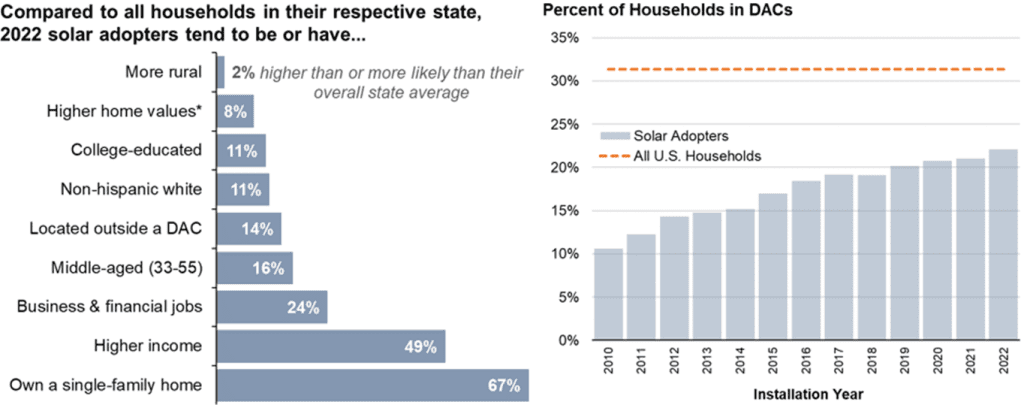
Solar adopters differ from the broader population in terms of many other socio-economic attributes, though those differences are also diminishing over time. As shown in the left-hand panel in Figure 4, compared to all households in their respective state, solar adopters tend to: be negligibly more rural; have higher home values; and are more likely to be college-educated, identify as non-Hispanic white, live outside a disadvantaged community (DAC), be middle-aged, work in a business or financial occupation, and own a single-family home. Most of those differences are shrinking over time, as solar adopters increasingly resemble the broader population. As one indicator, the right-hand panel in Figure 4 shows how PV adoption within DACs has been steadily rising over time, from 11% in 2010 to 22% in 2022.
In addition to the various national trends highlighted above, the report also compares state-level trends, and more-granular data at the county and tract level are available through Berkeley Lab’s online solar demographics tool. Berkeley Lab has also published numerous analyses on specific topics related to expanding solar access and equity, available at http://solardemographics.lbl.gov.
For questions on the report or data tool, contact Sydney Forrester (510-486-4123, SPForrester@lbl.gov) or Galen Barbose (510-495-2593, GLBarbose@lbl.gov).