Feb 13, 2023
The California New Solar Home Market is Strong, Less So in Other States
New Berkeley Lab study provides insights into the new home solar market across the US.
By: Ben Hoen
New homes provide a ready option for states hoping to reduce energy use, as evidenced by the steady increase in energy efficiency requirements in new home building codes. A less common approach is to specifically encourage or require new homes to produce their own carbon-free energy, though California has been doing just that: first incentivizing starting in 2007, then in 2018 requiring, new homes to have solar. Adopting these practices nationwide might significantly reduce new home energy use, but the drivers of the new solar home market have not been well studied.
Partly filling that gap, we are pleased to release a new Lawrence Berkeley National Laboratory analysis “Starting with Solar: A Preliminary Assessment of Solar Energy Systems in Residential New Construction.” The study investigates the new solar home market inside and outside of California through 2020, just prior to the period when California’s 2018 New Solar Home Mandate (Building Energy Efficiency Standards, Title 24, Part 6) went into effect. We analyzed more than a half a million new home transactions from 2007-2020 and estimated new solar home adoption rates over time and among different cohorts to examine drivers of that adoption.
The study, published in slide-deck format, is available here. The authors will host a webinar covering the results of the study on February 15th at 1 PM Eastern / 10 AM Pacific. (Register here.)
The following are a few key preliminary takeaways from the analysis:
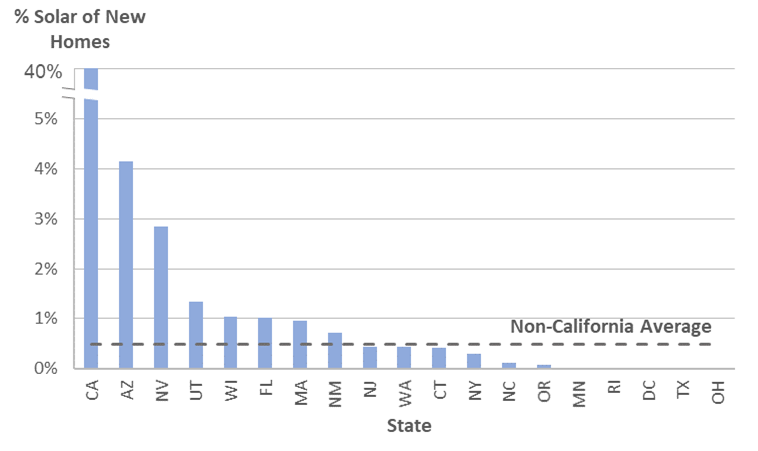
New solar home adoption in California eclipses—by a wide margin—adoption rates outside of California where we had data.
In 2018-2019, the end of our study period, solar homes represented roughly 40% of all new homes in California, while in other states where we had data, average adoption rates were less than 0.5% (see Figure 1). Solar adoption rates outside of California varied: topping the list was Arizona at greater than 4% and Nevada at almost 3%, both roughly 10 times smaller than California.
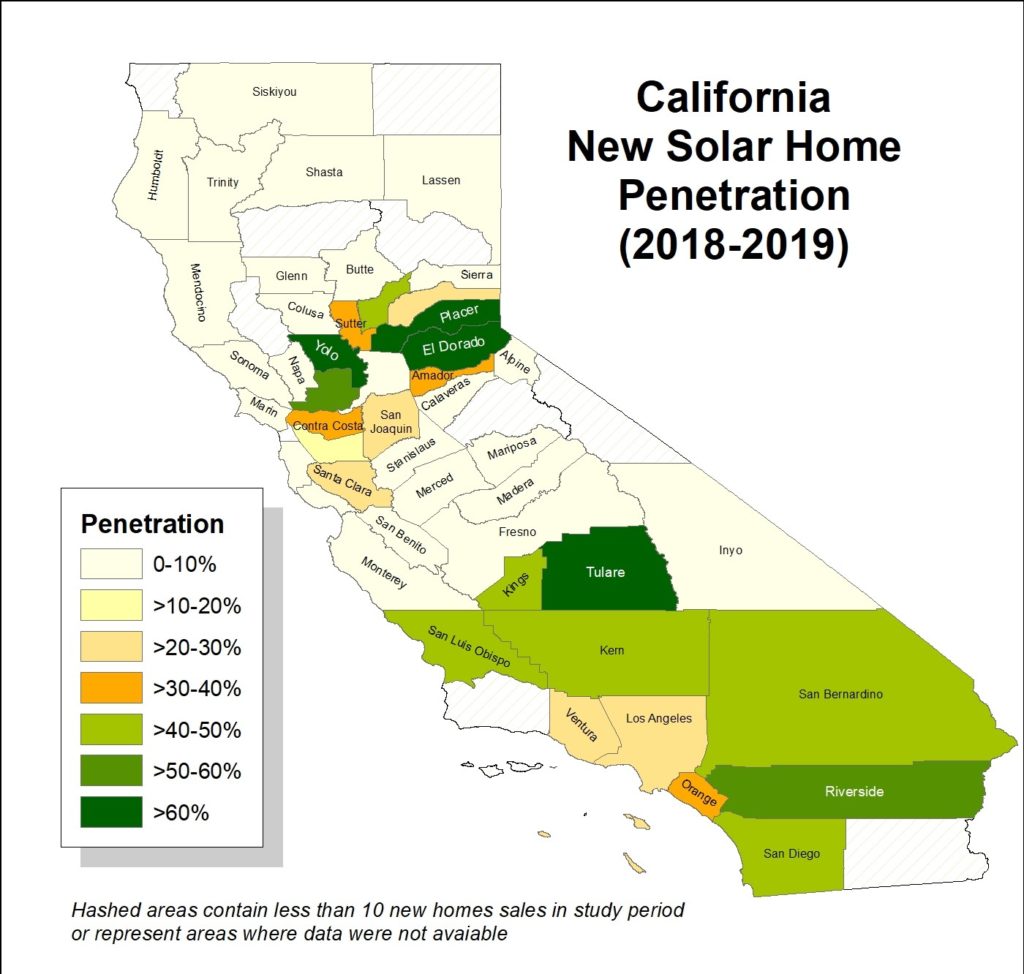
New solar home penetrations within California counties ranged widely.
Some California counties, for example Tulare, El Dorado, Yolo and Placer, had penetrations over 60% while many others were less than 10% (see Figure 2).
The presence of California’s New Solar Home Partnership (NSHP) incentives appear strongly correlated with higher deployment levels.
California offered financial incentives for solar in new homes from 2007 through 2020, when the New Solar Home Mandate went into effect. We found that new solar home penetrations in areas where NSHP incentives were available historically have been much higher than in other areas of California that lacked those incentives. Specifically, in investor-owned utility (IOU) areas of the state where NSHP incentives were available, recent new solar home penetration rates were approximately 50%. Outside those IOU areas, penetrations were less than 5%. Multi-variable statistical analysis showed the strong correlation of the NSHP incentives to penetration levels, relative to other relevant drivers.
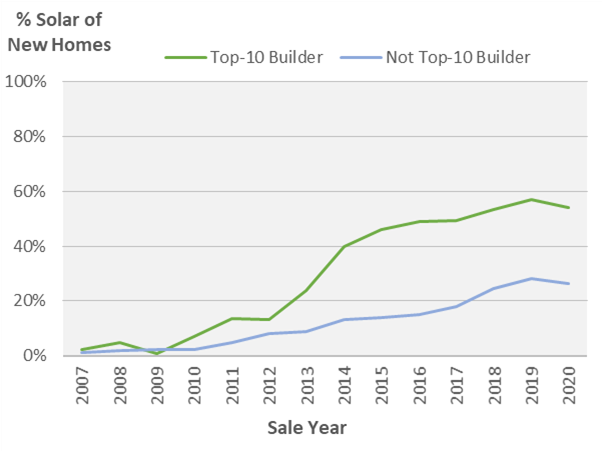
Builder market share appears to have driven deployment as well, at least in California.
The Top-10 or Top-25 largest California builders based on new home market share (i.e., both solar and non-solar) had much higher new solar home deployment levels than their smaller-builder peers, even within the areas where NSHP incentives were offered. Conversations with builders revealed that larger builders have the capacity to change their practices and to hire people to focus on collecting incentives, both of which were identified as factors in higher new solar home penetration levels. Builders with smaller market shares might have been less likely to develop these capacities, even when policies existed to encourage adoption.
We also examined the effect of electricity rates, home values, population density, and builder market share outside of California on solar penetrations in new home markets. Though some relationships between new solar home adoption and these variables exist, those statistical associations are relatively weak in comparison to California’s NSHP program and builder market share.
Additionally, we explored the differences in solar systems and home characteristics among solar and non-solar new homes, and we examined if and how those characteristics differ inside and outside of California, and for solar systems installed on existing homes. We find that new home solar system sizes are well below those of existing homes. This disparity remains when controlling for building size, potentially suggesting that new home solar systems are not being sized to offset all of the homes’ energy use or that new homes’ efficiency levels are dramatically reducing the need for solar energy, or both. We also found new solar homes were less likely to have batteries installed but more likely to have a third-party owner for the system. This preliminary analysis invites future study that can unpack some of the relationships we discovered.
The dataset was assembled by combining Berkeley Lab’s Tracking the Sun dataset with CoreLogic data on home transactions and characteristics in zip codes where at least one solar home (new or existing) was located. This allowed us to look at both new solar homes and new homes without solar, as well as existing homes that had solar installed.
We thank the U.S. Department of Energy’s Solar Energy Technologies Office for their support of this work, as well as the numerous individuals and organizations who generously provided data and information.
The Electricity Markets and Policy Department at Berkeley Lab conducts technical, economic, and policy analysis of energy topics centered on the U.S. electricity sector.
Related Articles
Indoor Air Quality for the HVAC Technician – Part 2


Infographic Shows ROI for Modern Energy Codes
