Sep 5, 2024
What Last Year’s IRS Data Tells Us About How Home Energy Tax Credits Are Being Used
Here are the biggest takeaways for high-performance contractors in the solar, HVAC, and home performance industries.
By: Cory Allyn

Earlier this month, the IRS released a large amount of data on returns for the 2023 tax year that claimed one or both of two home energy tax credits: the Residential Clean Energy Credit (often called the solar tax credit, even though it covers more than just solar panels), and the Energy Efficient Home Improvement Credit (often known as the 25C tax credit).
We’ve saved you the trouble of digging through the data yourself—here’s what we learned and what we think are the biggest takeaways for high-performance contractors in the solar, HVAC, and home performance industries.
Basic Stats About Households Claiming a Home Energy Tax Credit
Total number of returns claiming one or both tax credits for the 2023 tax year: 3,421,880 (2.48% of all returns)
Residential Clean Energy Credit
Total number of returns for the 2023 tax year: 1,246,440
Number of returns claiming a credit carried forward from the previous year: 539,630
Number of returns that will have a credit balance for the 2024 tax year: 601,300
Average credit amount: $5,084
Energy Efficient Home Improvement Credit
Total number of returns for the 2023 tax year: 2,338,430
Average credit amount: $882
*This credit cannot be carried forward to future years
Most Frequently Claimed Home Upgrades
| Upgrade | Annual Cap? | Number of Returns Filed |
| Solar panels | No | 752,300 |
| Insulation & air sealing | Yes, $1,200 | 699,440 |
| High efficiency central air conditioners | Yes, $600 | 488,050 |
| High efficiency natural gas, propane or oil water heaters | Yes, $600 | 293,300 |
| High efficiency furnace and boiler heating systems | Yes, $600 | 283,390 |
| Heat pumps (incl. ducted and ductless mini-splits) | Yes, $2,000 | 267,780 |
| Heat pump water heaters | Yes, $2,000 | 104,180 |
| Electrical upgrades | Yes, $600 | 93,330 |
| Geothermal heat pumps | No | 80,730 |
| Battery storage | No | 48,840 |
| Home energy audits | Yes, $150 | 36,820 |
Demographic Breakdown of Households That Claimed a Home Energy Credit
States Where the Clean Energy Credit Was Claimed the Most

Number of states with at least 1% of its total tax returns claiming the credit: 10
States Where the Energy Efficient Home Improvement Credit was Claimed the Most

Number of states with at least 1% of its total tax returns claiming the credit: 47
Key Takeaways and Thoughts to Chew On for Insulation, Solar, and HVAC Contractors
- Recent changes from the Inflation Reduction Act are driving more people to use home energy credits. According to the Treasury, “The number of families benefiting from these credits has increased almost one third and the aggregate value of the credits has increased by almost two thirds.”
- Using the tax credit for insulation and air sealing is very popular, despite having the most significant restrictions of any major eligible home upgrade (unlike all other upgrades, onsite labor costs are not eligible for insulation and air sealing work).
- Heat pumps are the most potentially lucrative of all heating, cooling, and hot water upgrades in the Energy Efficient Home Improvement Credit ($2,000 cap compared to $600), and they’ve outsold gas furnaces for the second straight year. But heat pumps and heat pump water heaters were the least claimed upgrade for tax credit purposes last year.
- The vast majority of US households have not claimed a home energy tax credit yet, but nearly 3.5 million did last year. Our question is: how many homeowners would take advantage but aren’t aware that the tax credit exists? Contractors running effective marketing and sales campaigns involving tax credits are in a great position to capitalize.
- Of the 3.5 million returns claiming a home energy tax credit last year, only 162,990 returns claimed both credits, which is less than 5%. For contractors, this suggests that a sizable number of households are both aware of and have utilized a tax credit in the past for home improvements—and still are likely in need of additional upgrades.
- The Energy Efficient Home Improvement Credit is much more widely utilized than the Clean Energy Credit, despite the average credit amount being 6x less. So why are solar contractors more likely to promote and run marketing and advertising campaigns around the Clean Energy Credit than home performance and HVAC contractors are for the Energy Efficient Home Improvement Credit??
- How does climate affect use or popularity of home energy tax credits? Looking at the map charts above, sunnier states saw more homeowners taking the Clean Energy Credit, while colder states saw more homeowners claiming the Energy Efficient Home Improvement Credit (even though central AC was the single most claimed heating and cooling upgrade).
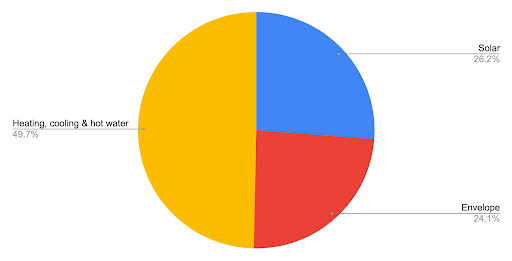
- While solar panels and insulation were the two largest individual upgrades claimed, all heating, cooling, and hot water heater upgrades combined was a far bigger slice of the pie, suggesting that HVAC contractors’ customers are most likely to claim a tax credit.
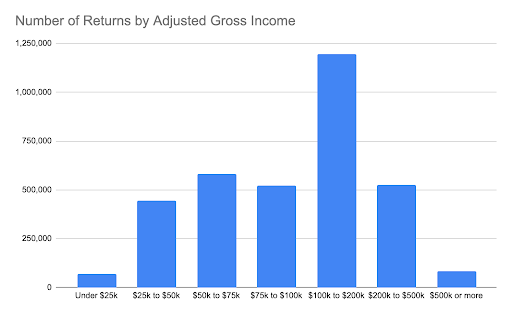
- Just about half of all households claiming one or both of the tax credits made under $100,000, and more than half a million households claiming the credit made under $50,000. Despite conventional wisdom that tax credits are mostly taken by the wealthy, this presents clear evidence that tax credits can be effective messaging for contractors looking to target LMI households.
- A fun trivia fact to end on: Rhode Island is the only state to rank in the top 10 for both home energy credits. Congrats to Little Rhode for putting up big numbers!
This article was originally published in the Energy Circle Blog and is republished with permission.