Navigating the Inflation Reduction Act
What energy efficiency businesses need to know.
BPA’s latest achievement is helping to secure billions of dollars in rebates and incentives for home energy efficiency and electrification, plus hundreds of millions of dollars to train workers for the jobs that funding will create by helping shape the 2022 Inflation Reduction Act (IRA).
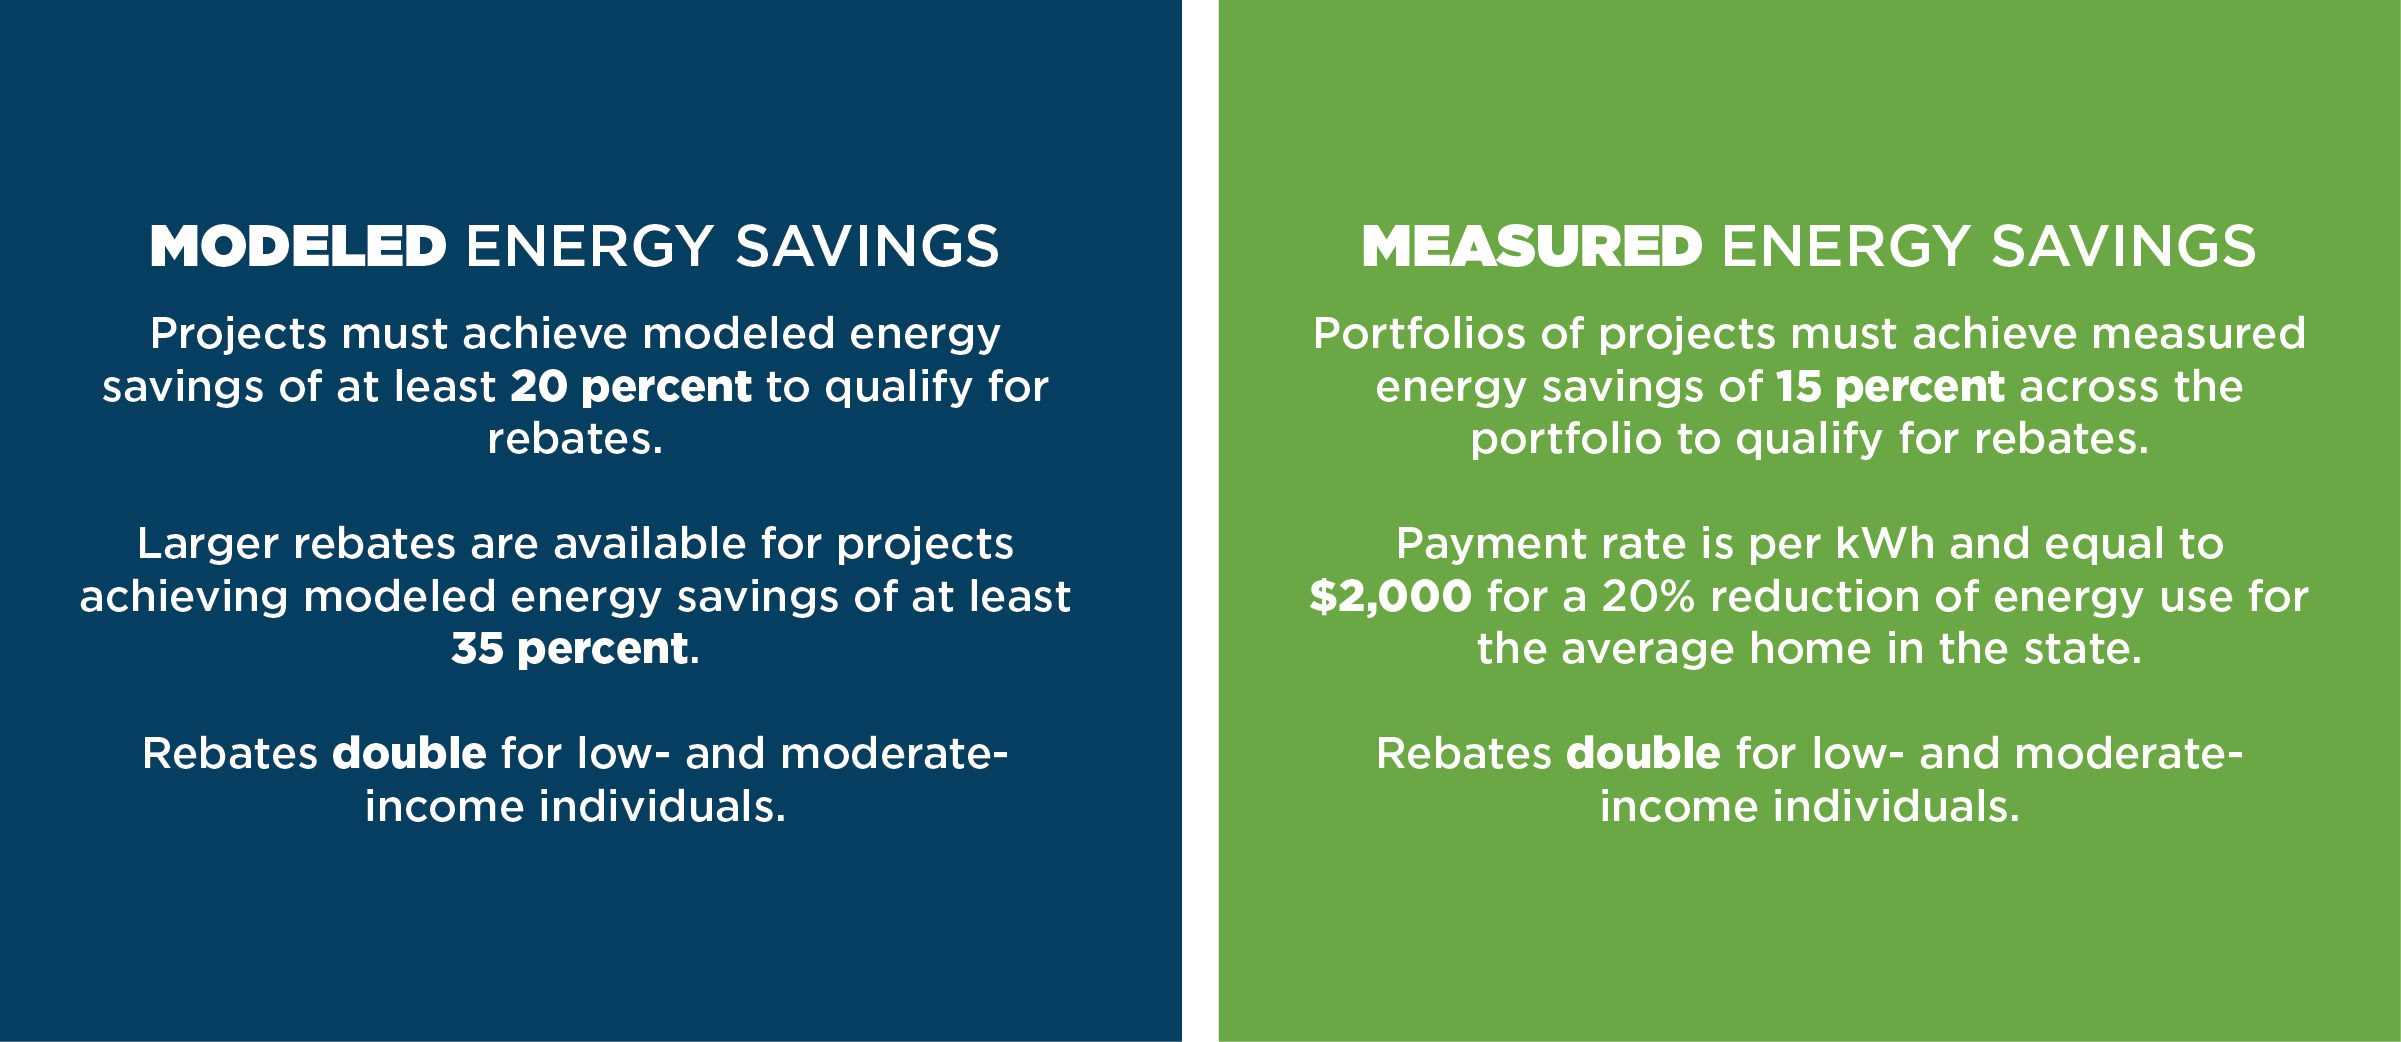
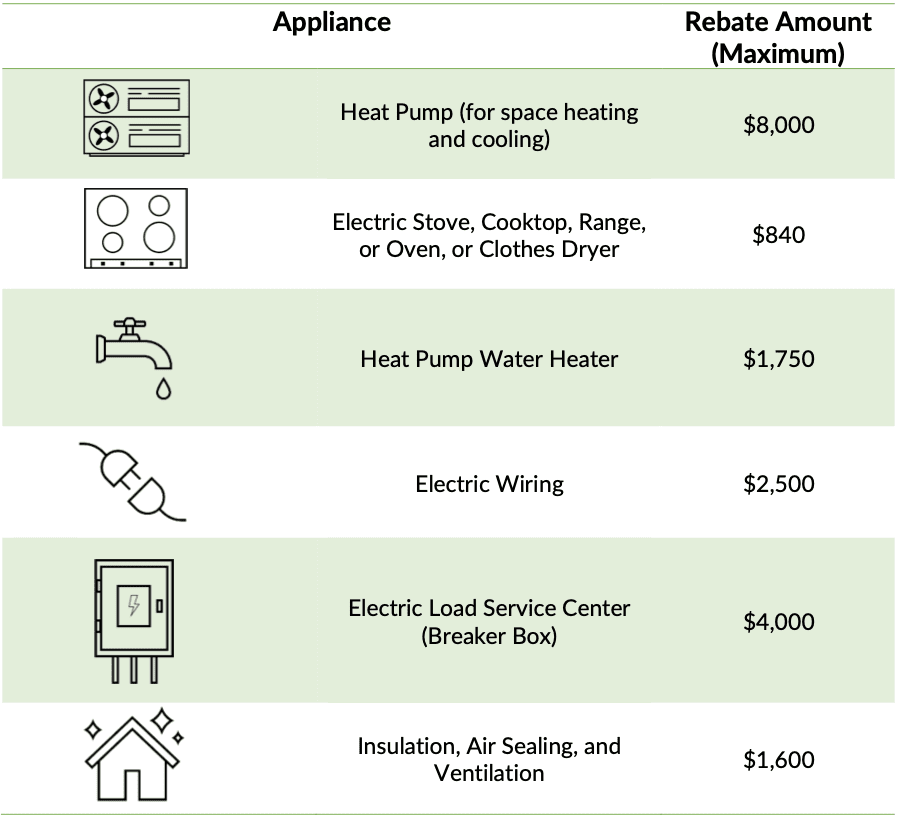
What's in the IRA for Home Performance Contractors & Consumers?


Inflation Reduction Act Resources
IAQ Radio: Nate Adams – Electrification, Heat Pumps, IAQ & The Inflation Reduction Act
Watch episode 667 covering electrification, heat pumps, IAQ, and the Inflation Reduction Act.
NEEP Policy Factsheet: Inflation Reduction Act
Get an overview of some of the provisions and incentives included in the Inflation Reduction Act.
CleanEnergy.gov Interactive Website
Visit this webiste to find out how you can take advantage of the Inflation Reduction Act from the White House itself.
DOE: Home Energy Rebates: Communications and Marketing Toolkit
Resources for program administrators and other stakeholders to inform and educate the public about the Home Energy Rebate programs.
DOE Consumer Flyer: How to Get a Home Efficiency Rebate
DOE has developed one-page diagrams to help consumers understand the processes for determining eligibility and receiving a Home Efficiency Rebate.
DOE: Home Energy Rebates Evaluation Plan Template
This template is designed to provide guidance and support to states developing IRA Home Energy Rebates Evaluation Plans.

More Resources Available with BPA Membership
BPA members have access to even more benefits that will help them navigate the IRA. Join today for instant access to our IRA webinar series recordings and upcoming events.
Your State Allocations for Home Energy Rebate Program
This information is from the U.S. Department of Energy.
| Alaska | $37,368,480 | $37,150,940 | $74,519,420 |
| Alabama | $73,032,210 | $72,607,220 | $145,639,430 |
| Arkansas | $52,739,720 | $52,433,010 | $105,172,730 |
| American Samoa | $25,069,710 | $24,923,740 | $49,993,450 |
| Arizona | $76,868,720 | $76,421,080 | $153,289,800 |
| California | $291,951,040 | $290,252,580 | $582,203,620 |
| Colorado | $70,395,350 | $69,985,890 | $140,381,240 |
| Connecticut | $49,830,560 | $49,541,390 | $99,371,950 |
| District of Columbia | $29,808,850 | $29,635,400 | $59,444,250 |
| Delaware | $33,029,650 | $32,837,400 | $65,867,050 |
| Florida | $173,668,720 | $172,657,670 | $346,326,390 |
| Georgia | $109,817,290 | $109,178,020 | $218,995,310 |
| Guam | $25,815,420 | $25,665,110 | $51,480,530 |
| Hawaii | $34,293,520 | $34,093,900 | $68,387,420 |
| Iowa | $60,827,450 | $60,473,810 | $121,301,260 |
| Idaho | $40,604,320 | $40,367,910 | $80,972,230 |
| Illinois | $132,219,190 | $131,452,470 | $263,671,660 |
| Indiana | $91,302,840 | $90,772,430 | $182,075,270 |
| Kansas | $52,971,870 | $52,663,910 | $105,635,780 |
| Kentucky | $67,319,140 | $66,927,750 | $134,246,890 |
| Louisiana | $106,593,900 | $105,972,960 | $212,566,860 |
| Massachusetts | $73,233,910 | $72,809,130 | $146,043,040 |
| Maryland | $68,611,060 | $68,212,540 | $136,823,600 |
| Maine | $35,936,920 | $35,728,050 | $71,664,970 |
| Michigan | $105,904,990 | $105,291,160 | $211,196,150 |
| Minnesota | $74,459,590 | $74,027,440 | $148,487,030 |
| Missouri | $75,807,060 | $75,366,640 | $151,173,700 |
| Northern Marianas | $24,984,780 | $24,839,290 | $49,824,070 |
| Mississippi | $52,543,050 | $52,237,320 | $104,780,370 |
| Montana | $35,692,560 | $35,484,830 | $71,177,390 |
| North Carolina | $104,918,280 | $104,307,840 | $209,226,120 |
| North Dakota | $37,338,470 | $37,121,060 | $74,459,530 |
| Nebraska | $45,813,680 | $45,547,120 | $91,360,800 |
| New Hampshire | $34,952,780 | $34,749,580 | $69,702,360 |
| New Jersey | $91,840,040 | $91,307,380 | $183,147,420 |
| New Mexico | $43,999,070 | $43,742,970 | $87,742,040 |
| Nevada | $48,200,980 | $47,920,160 | $96,121,140 |
| New York | $159,338,380 | $158,415,850 | $317,754,230 |
| Ohio | $124,875,180 | $124,150,970 | $249,026,150 |
| Oklahoma | $64,764,840 | $64,388,040 | $129,152,880 |
| Oregon | $57,046,250 | $56,714,440 | $113,760,690 |
| Pennsylvania | $129,980,360 | $129,226,380 | $259,206,740 |
| Puerto Rico | $42,698,980 | $42,451,090 | $85,150,070 |
| Rhode Island | $32,006,100 | $31,820,030 | $63,826,130 |
| South Carolina | $68,852,430 | $68,451,650 | $137,304,080 |
| South Dakota | $34,379,110 | $34,178,990 | $68,558,100 |
| Tennessee | $ 83,877,940 | $83,390,060 | $167,268,000 |
| Texas | $346,022,980 | $344,006,590 | $690,029,570 |
| Utah | $50,698,180 | $50,403,030 | $101,101,210 |
| Virginia | $94,537,110 | $93,987,430 | $188,524,540 |
| U.S. Virgin Islands | $25,660,980 | $25,511,580 | $51,172,560 |
| Vermont | $29,362,920 | $29,192,160 | $58,555,080 |
| Washington | $83,266,580 | $82,782,050 | $166,048,630 |
| Wisconsin | $74,904,830 | $74,470,200 | $149,375,030 |
| West Virginia | $44,275,290 | $44,017,970 | $88,293,260 |
| Wyoming | $34,686,390 | $34,484,390 | $69,170,780 |
Training Residential Contractors Grants
This information is from the U.S. Department of Energy.
| Alabama | $2,562,900 | $1,281,450 | $1,281,450 |
| Alaska | $1,296,870 | $648,435 | $648,435 |
| American Samoa | $864,460 | $432,230 | $432,230 |
| Arizona | $2,642,230 | $1,321,115 | $1,321,115 |
| Arkansas | $1,881,690 | $940,845 | $940,845 |
| California | $10,321,930 | $5,160,965 | $5,160,965 |
| Colorado | $2,501,170 | $1,250,585 | $1,250,585 |
| Connecticut | $1,881,620 | $940,810 | $940,810 |
| Delaware | $1,151,040 | $575,520 | $575,520 |
| District of Columbia | $1,048,490 | $524,245 | $524,245 |
| Florida | $6,021,760 | $3,010,880 | $3,010,880 |
| Georgia | $3,816,060 | $1,908,030 | $1,908,030 |
| Guam | $891,700 | $445,850 | $445,850 |
| Hawaii | $1,194,820 | $597,410 | $597,410 |
| Idaho | $1,403,750 | $701,875 | $701,875 |
| Illinois | $5,086,340 | $2,543,170 | $2,543,170 |
| Indiana | $3,354,110 | $1,677,055 | $1,677,055 |
| Iowa | $2,188,600 | $1,094,300 | $1,094,300 |
| Kansas | $1,908,060 | $954,030 | $954,030 |
| Kentucky | $2,420,420 | $1,210,210 | $1,210,210 |
| Louisiana | $3,633,890 | $1,816,945 | $1,816,945 |
| Maine | $1,303,340 | $651,670 | $651,670 |
| Maryland | $2,531,970 | $1,265,985 | $1,265,985 |
| Massachusetts | $2,797,870 | $1,398,935 | $1,398,935 |
| Michigan | $4,124,380 | $2,062,190 | $2,062,190 |
| Minnesota | $2,802,670 | $1,401,335 | $1,401,335 |
| Mississippi | $1,848,620 | $924,310 | $924,310 |
| Missouri | $2,779,120 | $1,389,560 | $1,389,560 |
| Montana | $1,248,470 | $624,235 | $624,235 |
| Nebraska | $1,614,510 | $807,255 | $807,255 |
| Nevada | $1,637,710 | $818,855 | $818,855 |
| New Hampshire | $1,259,230 | $629,615 | $629,615 |
| New Jersey | $3,517,680 | $1,758,840 | $1,758,840 |
| New Mexico | $1,533,830 | $766,915 | $766,915 |
| New York | $6,369,300 | $3,184,650 | $3,184,650 |
| North Carolina | $3,698,030 | $1,849,015 | $1,849,015 |
| North Dakota | $1,288,200 | $644,100 | $644,100 |
| Northern Marianas | $860,940 | $430,470 | $430,470 |
| Ohio | $4,791,100 | $2,395,550 | $2,395,550 |
| Oklahoma | $2,286,480 | $1,143,240 | $1,143,240 |
| Oregon | $2,028,480 | $1,014,240 | $1,014,240 |
| Pennsylvania | $4,960,910 | $2,480,455 | $2,480,455 |
| Puerto Rico | $1,594,690 | $797,345 | $797,345 |
| Rhode Island | $1,154,250 | $577,125 | $577,125 |
| South Carolina | $2,397,600 | $1,198,800 | $1,198,800 |
| South Dakota | $1,195,450 | $597,725 | $597,725 |
| Tennessee | $2,980,770 | $1,490,385 | $1,490,385 |
| Texas | $11,674,260 | $5,837,130 | $5,837,130 |
| U.S. Virgin Islands | $889,010 | $444,505 | $444,505 |
| Utah | $1,757,330 | $878,665 | $878,665 |
| Vermont | $1,048,680 | $524,340 | $524,340 |
| Virginia | $3,393,040 | $1,696,520 | $1,696,520 |
| Washington | $2,925,550 | $1,462,775 | $1,462,775 |
| West Virginia | $1,607,110 | $803,555 | $803,555 |
| Wisconsin | $2,835,440 | $1,417,720 | $1,417,720 |
| Wyoming | $1,192,070 | $596,035 | $596,035 |