Navigating Home Energy Rebates
What energy efficiency businesses need to know.
BPA helped shape the 2022 Inflation Reduction Act, securing $8.8 billion in State Home Energy Rebate funds for homeowners and contractors. BPA is tracking program developments and keeping its network informed.
Important Documents & Resources
New — June 2026 program guidance
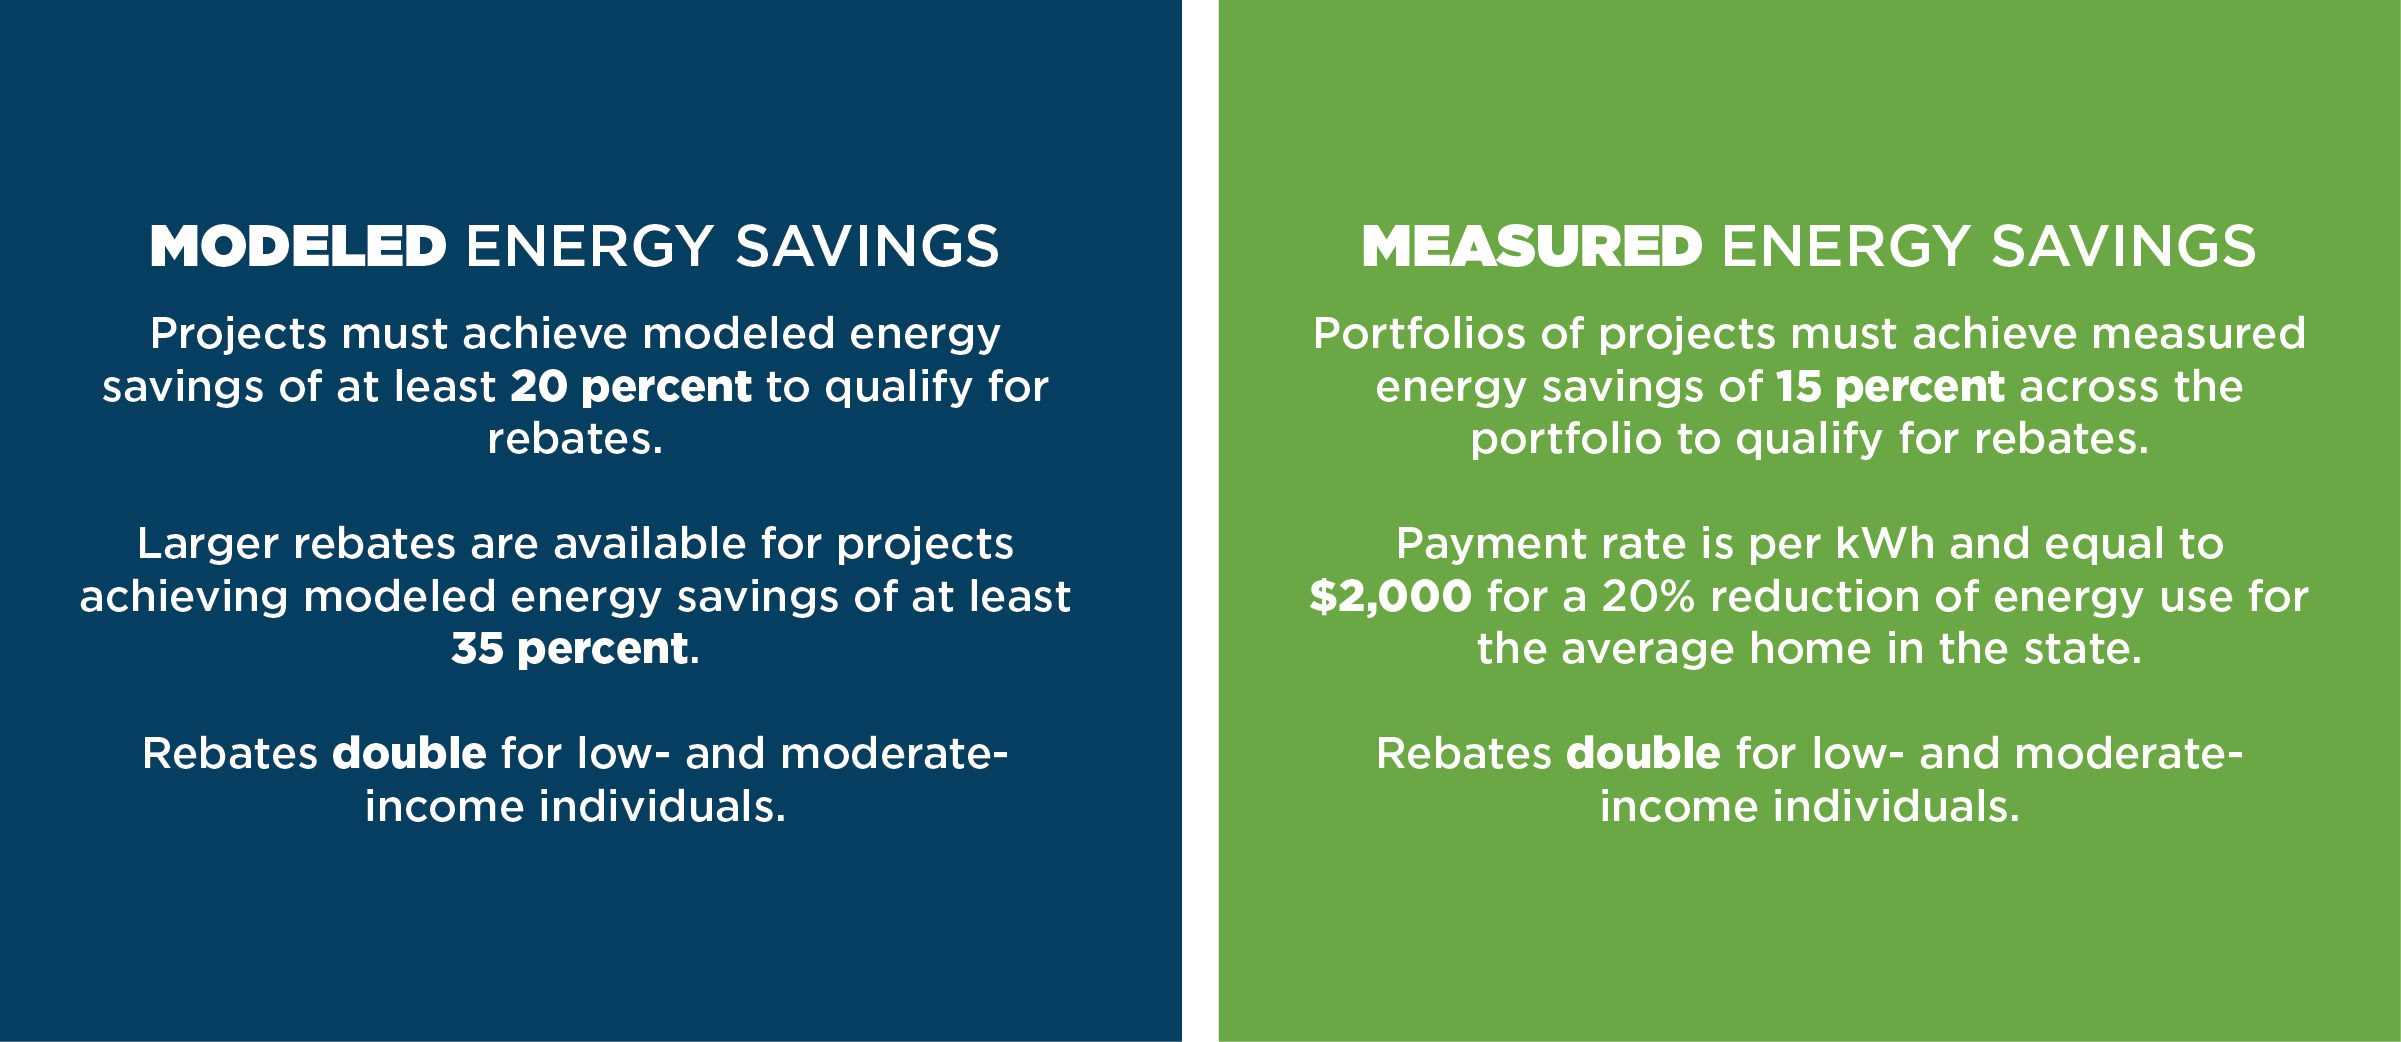
How Can Home Performance Contractors & Consumers Use Energy Rebates?


Energy Rebates Resources
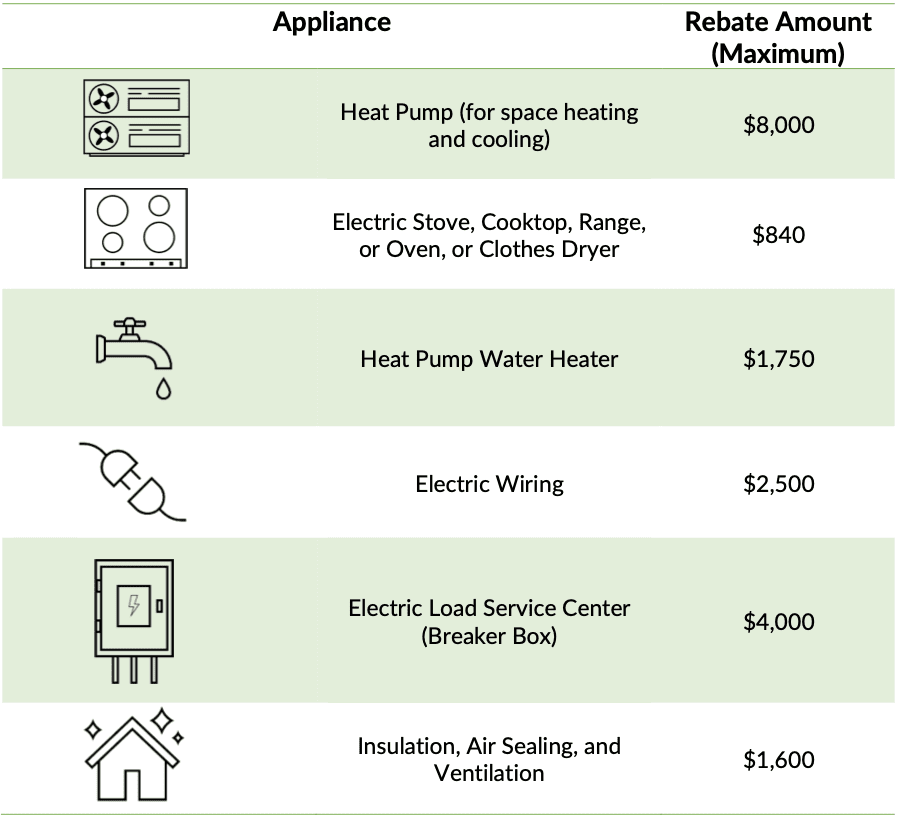
DOE Consumer Flyer: How to Get a Home Electrification and Appliance Rebate
DOE has developed one-page diagrams to help consumers understand the processes for determining eligibility and receiving a Home Electrification and Appliance Rebate
Residential Products Meeting CEE’s Highest Tier
See a summary of products that meet the highest efficiency tiers established by the Consortium for Energy Efficiency (CEE).
IRS: Residential Clean Energy Credit (25D)
This flyer explains which home energy efficiency installations are eligible for clean energy credits and how to apply for the tax credits.
IRS: Energy Efficient Home Improvement Credit (25C)
This flyer explains how consumers can save money on utility bills & receive tax credits for home energy efficiency improvements.
Efficiency Vermont: Rewiring America Calculator
Efficiency Vermont offers an energy opportunites calculator to give details about potential incentives available by zip code.
Webinar Playback: Demystifying Aggregators: Unlocking IRA Rebates to Grow Your Business
Speakers discuss how aggregators can simplify the rebate process and the data requirements for the IRA Home Efficiency Rebate Program.

More Resources Available with BPA Membership
BPA members have access to even more benefits that will help them navigate the IRA. Join today for instant access to our IRA webinar series recordings and upcoming events.
Your State Allocations for Home Energy Rebate Program
This information is from the U.S. Department of Energy.
| Alaska | $37,368,480 | $37,150,940 | $74,519,420 |
| Alabama | $73,032,210 | $72,607,220 | $145,639,430 |
| Arkansas | $52,739,720 | $52,433,010 | $105,172,730 |
| American Samoa | $25,069,710 | $24,923,740 | $49,993,450 |
| Arizona | $76,868,720 | $76,421,080 | $153,289,800 |
| California | $291,951,040 | $290,252,580 | $582,203,620 |
| Colorado | $70,395,350 | $69,985,890 | $140,381,240 |
| Connecticut | $49,830,560 | $49,541,390 | $99,371,950 |
| District of Columbia | $29,808,850 | $29,635,400 | $59,444,250 |
| Delaware | $33,029,650 | $32,837,400 | $65,867,050 |
| Florida | $173,668,720 | $172,657,670 | $346,326,390 |
| Georgia | $109,817,290 | $109,178,020 | $218,995,310 |
| Guam | $25,815,420 | $25,665,110 | $51,480,530 |
| Hawaii | $34,293,520 | $34,093,900 | $68,387,420 |
| Iowa | $60,827,450 | $60,473,810 | $121,301,260 |
| Idaho | $40,604,320 | $40,367,910 | $80,972,230 |
| Illinois | $132,219,190 | $131,452,470 | $263,671,660 |
| Indiana | $91,302,840 | $90,772,430 | $182,075,270 |
| Kansas | $52,971,870 | $52,663,910 | $105,635,780 |
| Kentucky | $67,319,140 | $66,927,750 | $134,246,890 |
| Louisiana | $106,593,900 | $105,972,960 | $212,566,860 |
| Massachusetts | $73,233,910 | $72,809,130 | $146,043,040 |
| Maryland | $68,611,060 | $68,212,540 | $136,823,600 |
| Maine | $35,936,920 | $35,728,050 | $71,664,970 |
| Michigan | $105,904,990 | $105,291,160 | $211,196,150 |
| Minnesota | $74,459,590 | $74,027,440 | $148,487,030 |
| Missouri | $75,807,060 | $75,366,640 | $151,173,700 |
| Northern Marianas | $24,984,780 | $24,839,290 | $49,824,070 |
| Mississippi | $52,543,050 | $52,237,320 | $104,780,370 |
| Montana | $35,692,560 | $35,484,830 | $71,177,390 |
| North Carolina | $104,918,280 | $104,307,840 | $209,226,120 |
| North Dakota | $37,338,470 | $37,121,060 | $74,459,530 |
| Nebraska | $45,813,680 | $45,547,120 | $91,360,800 |
| New Hampshire | $34,952,780 | $34,749,580 | $69,702,360 |
| New Jersey | $91,840,040 | $91,307,380 | $183,147,420 |
| New Mexico | $43,999,070 | $43,742,970 | $87,742,040 |
| Nevada | $48,200,980 | $47,920,160 | $96,121,140 |
| New York | $159,338,380 | $158,415,850 | $317,754,230 |
| Ohio | $124,875,180 | $124,150,970 | $249,026,150 |
| Oklahoma | $64,764,840 | $64,388,040 | $129,152,880 |
| Oregon | $57,046,250 | $56,714,440 | $113,760,690 |
| Pennsylvania | $129,980,360 | $129,226,380 | $259,206,740 |
| Puerto Rico | $42,698,980 | $42,451,090 | $85,150,070 |
| Rhode Island | $32,006,100 | $31,820,030 | $63,826,130 |
| South Carolina | $68,852,430 | $68,451,650 | $137,304,080 |
| South Dakota | $34,379,110 | $34,178,990 | $68,558,100 |
| Tennessee | $ 83,877,940 | $83,390,060 | $167,268,000 |
| Texas | $346,022,980 | $344,006,590 | $690,029,570 |
| Utah | $50,698,180 | $50,403,030 | $101,101,210 |
| Virginia | $94,537,110 | $93,987,430 | $188,524,540 |
| U.S. Virgin Islands | $25,660,980 | $25,511,580 | $51,172,560 |
| Vermont | $29,362,920 | $29,192,160 | $58,555,080 |
| Washington | $83,266,580 | $82,782,050 | $166,048,630 |
| Wisconsin | $74,904,830 | $74,470,200 | $149,375,030 |
| West Virginia | $44,275,290 | $44,017,970 | $88,293,260 |
| Wyoming | $34,686,390 | $34,484,390 | $69,170,780 |
Training Residential Contractors Grants
This information is from the U.S. Department of Energy.
| Alabama | $2,562,900 | $1,281,450 | $1,281,450 |
| Alaska | $1,296,870 | $648,435 | $648,435 |
| American Samoa | $864,460 | $432,230 | $432,230 |
| Arizona | $2,642,230 | $1,321,115 | $1,321,115 |
| Arkansas | $1,881,690 | $940,845 | $940,845 |
| California | $10,321,930 | $5,160,965 | $5,160,965 |
| Colorado | $2,501,170 | $1,250,585 | $1,250,585 |
| Connecticut | $1,881,620 | $940,810 | $940,810 |
| Delaware | $1,151,040 | $575,520 | $575,520 |
| District of Columbia | $1,048,490 | $524,245 | $524,245 |
| Florida | $6,021,760 | $3,010,880 | $3,010,880 |
| Georgia | $3,816,060 | $1,908,030 | $1,908,030 |
| Guam | $891,700 | $445,850 | $445,850 |
| Hawaii | $1,194,820 | $597,410 | $597,410 |
| Idaho | $1,403,750 | $701,875 | $701,875 |
| Illinois | $5,086,340 | $2,543,170 | $2,543,170 |
| Indiana | $3,354,110 | $1,677,055 | $1,677,055 |
| Iowa | $2,188,600 | $1,094,300 | $1,094,300 |
| Kansas | $1,908,060 | $954,030 | $954,030 |
| Kentucky | $2,420,420 | $1,210,210 | $1,210,210 |
| Louisiana | $3,633,890 | $1,816,945 | $1,816,945 |
| Maine | $1,303,340 | $651,670 | $651,670 |
| Maryland | $2,531,970 | $1,265,985 | $1,265,985 |
| Massachusetts | $2,797,870 | $1,398,935 | $1,398,935 |
| Michigan | $4,124,380 | $2,062,190 | $2,062,190 |
| Minnesota | $2,802,670 | $1,401,335 | $1,401,335 |
| Mississippi | $1,848,620 | $924,310 | $924,310 |
| Missouri | $2,779,120 | $1,389,560 | $1,389,560 |
| Montana | $1,248,470 | $624,235 | $624,235 |
| Nebraska | $1,614,510 | $807,255 | $807,255 |
| Nevada | $1,637,710 | $818,855 | $818,855 |
| New Hampshire | $1,259,230 | $629,615 | $629,615 |
| New Jersey | $3,517,680 | $1,758,840 | $1,758,840 |
| New Mexico | $1,533,830 | $766,915 | $766,915 |
| New York | $6,369,300 | $3,184,650 | $3,184,650 |
| North Carolina | $3,698,030 | $1,849,015 | $1,849,015 |
| North Dakota | $1,288,200 | $644,100 | $644,100 |
| Northern Marianas | $860,940 | $430,470 | $430,470 |
| Ohio | $4,791,100 | $2,395,550 | $2,395,550 |
| Oklahoma | $2,286,480 | $1,143,240 | $1,143,240 |
| Oregon | $2,028,480 | $1,014,240 | $1,014,240 |
| Pennsylvania | $4,960,910 | $2,480,455 | $2,480,455 |
| Puerto Rico | $1,594,690 | $797,345 | $797,345 |
| Rhode Island | $1,154,250 | $577,125 | $577,125 |
| South Carolina | $2,397,600 | $1,198,800 | $1,198,800 |
| South Dakota | $1,195,450 | $597,725 | $597,725 |
| Tennessee | $2,980,770 | $1,490,385 | $1,490,385 |
| Texas | $11,674,260 | $5,837,130 | $5,837,130 |
| U.S. Virgin Islands | $889,010 | $444,505 | $444,505 |
| Utah | $1,757,330 | $878,665 | $878,665 |
| Vermont | $1,048,680 | $524,340 | $524,340 |
| Virginia | $3,393,040 | $1,696,520 | $1,696,520 |
| Washington | $2,925,550 | $1,462,775 | $1,462,775 |
| West Virginia | $1,607,110 | $803,555 | $803,555 |
| Wisconsin | $2,835,440 | $1,417,720 | $1,417,720 |
| Wyoming | $1,192,070 | $596,035 | $596,035 |