Jul 26, 2021
Efficiency Vermont’s Low-Income Program: Determining Disparate Impacts
In this part of Efficiency Vermont’s Low-Income Program, the focus is determining disparate impacts
By: By Lauren Wentz, Elizabeth Palchak, Robert Stephenson, and Emily Levin
Efficiency Vermont’s Targeted High Use (THU) program provides direct installation of electric-saving products and appliances, including refrigerators, freezers, clothes washers, dehumidifiers, heat pumps, and heat pump water heaters, to qualifying households with high electricity usage. Through an annual direct mail outreach campaign, Efficiency Vermont historically promoted its THU program to customers who were likely to be income-eligible and were confirmed through available utility data to have used at least 10,000 kwh/year, a high level of electricity usage for residential customers in Vermont.
But in 2019, Efficiency Vermont elected to shift to its tactic in order to reach more eligible customers who were excluded from prior mailing lists due to unconfirmed utility account data. They sent a mailing to 50,000 known low-income customers across the state, and while 68% of people called in response, most of the customers failed to qualify because they did not meet the program’s high electric usage requirement. Unsurprisingly, customer feedback was overwhelmingly negative after receiving this information, leading to a substantial reduction in customer satisfaction.
Efficiency Vermont responded to this feedback and redesigned the THU program by addressing three dimensions of equity: including representative voices in program design and delivery, defining target populations, and determining disparate impacts of programs.
This article will cover the third of these dimensions: determining disparate impacts. You can read about including representative voices in our previous article here, and about defining target populations in our previous article here.
Determining Disparate Impacts
Overview of Concept
Assessing disparities in outcomes is another way to account for inequities. This can be addressed by a comparative analysis of program impacts by population segments, markets and program focus areas. The determination of inequities of program impacts typically includes an evaluation of:
- Impacts for a targeted group and the share of those impacts compared to those for the total program-eligible population; or
- Program outcomes for a targeted group compared to other groups or program outcomes.
If outcomes represent less than the target population’s share relative to the total population, or if targeted program impacts are less than those from other programs on a per participant basis, the targeted group is likely underserved. Performance indicators in the clean energy industry often include savings and investment levels. However, these metrics do not always offer the complete description necessary to understand how well programs are addressing the needs of all customers. Clean energy programs most often address these metrics when calculating disparities in program impacts:
- Program investment targets are often set based on contribution rates from different classes of ratepayers, with low-income spending targets set based on the total contribution from low-income ratepayers.
- Energy savings can be assessed at the participant level or site level.
- Energy cost savings is less often referenced and captures the amount of energy costs (utility or fuel bill) saved by program implementation.
- Program participation tracks the number of customers directly served by programs.
- Participation rate measures the level of participation as a proportion of potential or eligible customers. It may provide more information about how well a program is serving customers than individual participation numbers.
Methods and metrics for determining different impacts are influenced by the availability and granularity of data. More complex analyses require higher levels of funding to support the time necessary to integrate multiple data sets, but may provide much richer information to drive programming decisions.
Efficiency Vermont Experience
Efficiency Vermont examined the effectiveness of the changes to its low-income program offerings and whether additional opportunities existed to improve equity of program investment and impact through a set of comparative analyses. These analysis efforts included:
- Examinations of whether the impacts and investments associated with Efficiency Vermont’s low-income and THU programs were proportional to the state’s proportion of low-income residents;
- Comparisons of the program impacts of Efficiency Vermont’s targeted and nontargeted residential programs at the project level; and
- Geographic analysis of targeted program savings, spending, and participation.
Proportional Impact and Investment
Vermont regulators have set several minimum performance requirements for Efficiency Vermont, including sector equity requirements for spending targeting low-income Vermonters. These minimum requirements are based on the level of energy efficiency fund contributions from low-income customers as a percentage of overall resource acquisition budgets. For program years 2018-2020, the minimum spending requirement for Efficiency Vermont was set at 9%, based on an assumption that $17.4 million of the total $149 energy efficiency funding would come from low-income customers. The program does not have minimum requirements for low-income savings impacts.
The program has consistently met these minimum low-income program spending requirements, but how does the level of program investment and impact compare to the proportion of residential customers that are low-income? Researchers from the University of Michigan’s Urban Energy Justice Lab developed an approach to address these questions through a comparison of program investments and savings across different demographic groups. Their approach, which they deemed Energy Efficiency Equity Baseline (E3b), “estimates equitable utility investment [and savings] proportionate to the low-income population in the service territory and as a percentage of the total residential energy efficiency investment portfolio.” If a program’s investment or savings fall below these baselines, that would demonstrate a lack of proportional equity in program activities.
Applying this approach to Efficiency Vermont’s programs requires an estimate of the total low-income population in the service territory, as well as a review of program spending and savings. The Vermont Department of Public Service estimates that low-income households make up 31% of Efficiency Vermont residential customers. Following the E3b framework, if Efficiency Vermont’s spending and savings for targeted low-income programs did not make up 31% or more of the program’s outcomes, then the program activities could be considered nonproportional and opportunities may exist to create greater equity in program outcomes.
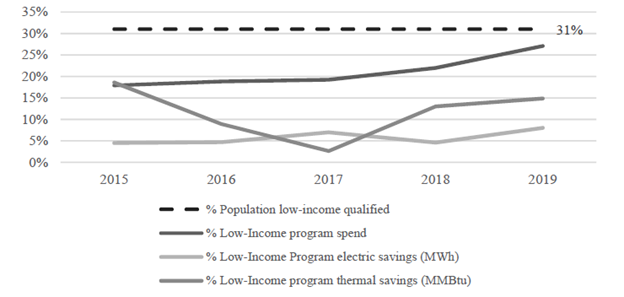
Targeted program spending for low-income customers has not met the spending baseline, but recent changes to Efficiency Vermont’s programs have shifted program investments in a more equitable direction. For program year 2019, targeted low-income programs made up 27% of residential program spending, a significant increase from 22% in 2018. Low-income customers can also participate in other residential mass-market programs for which savings and spending are not specifically attributed to the low-income program.
Reviewing program impacts versus the savings baseline shows a less clear picture in terms of trends and impacts for the program changes examined in this paper, but it does demonstrate that program savings for targeted low-income efforts represent a significantly smaller proportion of the program’s overall savings versus non-targeted programs. Efficiency Vermont implements both electric and thermal energy efficiency programs. Savings comparisons for electricity (MWh) and thermal fuels (MMBtu) are provided.
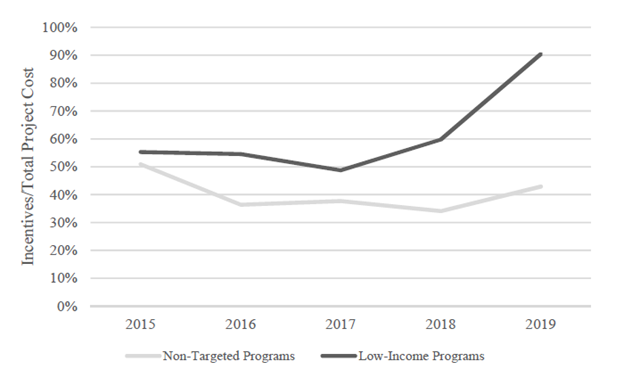
A major driver for this discrepancy is the portion of project and measure costs covered by Efficiency Vermont’s program incentives. Non-targeted program incentives tend to cover partial measure costs at a level intended to drive participant purchasing decisions towards more energy-efficient options, whereas targeted low-income programs usually cover a greater portion of total project costs. With higher savings acquisition costs for low-income programs, program investment may need to exceed a proportional baseline in order to achieve similar savings outcomes.
Impact and Investment Levels
To further examine the differences in impact between Efficiency Vermont’s targeted and non-targeted programs, energy savings on a per-project basis were examined for all residential programs. Given the high volume and low per-participant cost of the efficient products program, non-targeted programs were reviewed both excluding and including efficient products participant data.
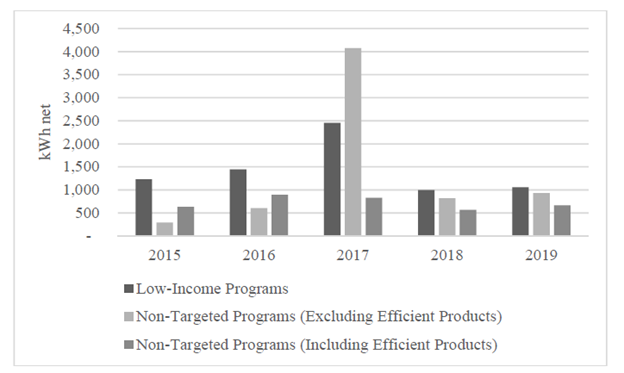
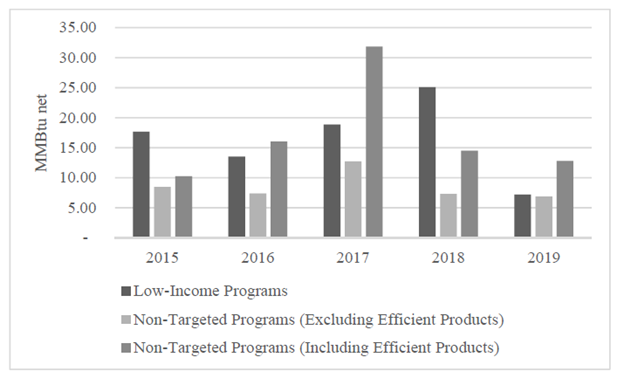
This analysis showed that low-income efforts produced valuable energy savings for participants, with impacts for low-income programs often exceeding those of non-targeted programs on a per capita basis. For the five years reviewed, average first year savings for low-income programs was 1,436 kWh and 16.5 MMBtu per participant, versus 1,344 kWh and 8.5 MMBtu for non-targeted programs excluding efficient products. Non-targeted programs including efficient products achieved and MMBtu 716 kWh and 16.1 MMBtu in first year savings.
Geographic Analysis
Where program administrator tracking records include the location of program activities, geographic analysis can be used to align program data with non-program data sources. This approach can serve to infer demographic and other information about program participants when that data is not collected directly. For example, demographic information collected by third-party surveys for a jurisdiction or geographic boundary can be assigned to program participants within those same boundaries. Linking of program and third-party data sets can be done through direct comparison but it is often done through GIS software, given the ability of those applications to align data by geographic boundary or proximity. This approach has some limitations; as noted by Energy Trust of Oregon in their work establishing baselines for program equity in 2018, “a notable limitation of geographic analysis is that we cannot make a direct link between community-level participation and the demographics of participants.”
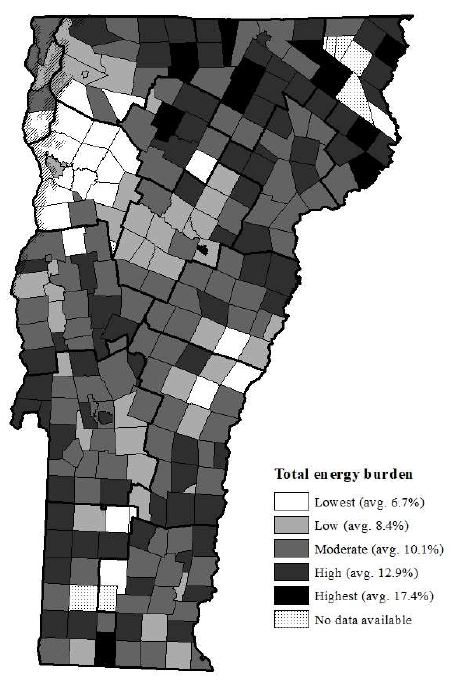
In 2019, Efficiency Vermont published a report that used geographic analysis to examine total energy burden by town across the state. The study estimated energy burden as the proportion of income necessary to cover total energy costs for thermal, electric, and transportation needs. This analysis used demographic analysis and other methods to align information and estimate energy costs and income for Vermont residents. The study used information from Efficiency Vermont’s program tracking database and third-party sources, including:
- American Community Survey: income and housing characteristic data
- Energy Information Administration: energy cost data
- Estimates of existing home heating usage from Efficiency Vermont’s Home Performance with ENERGY STAR program
- Vermont utilities: utility consumption data
- Housing and Transportation Affordability index: estimates of transportation costs
The study’s authors classified total energy burden into five different bins ranging from lowest to highest, with total energy costs ranging from an average of 6.7% of median income for towns in the lowest bin to an average of 17.4% for the highest bin. Figure 5. Map of total energy burden by town in Vermont maps the range of energy burdens across Vermont towns.
This geographic analysis was completed to examine program investment and impact within different Vermont communities. Efficiency Vermont tracks program impacts at the program and site level, enabling a comparison of energy savings and customer cost savings by town and program. As the THU and Appliance Replacement Voucher programs examined in this paper were focused on addressing discrepancies in participation rate and program impacts for those with high energy burdens, comparisons of program savings and participation across Vermont provide some initial feedback on whether those goals are being met. Reviewing the proportion of program impacts for towns in each energy burden bin provides some feedback on how well the program is meeting participation and depth of impact goals and whether the program’s results are reaching those Vermonters with the highest levels of energy burden.
Using site location information from the Efficiency Vermont program tracking database, residential program investment and savings for program year 2019 were totaled for each Vermont town. The total results for each energy burden range were summed based on the town’s energy burden bin to provide a proportion of program outcomes taking place across the range of energy burdens in the state. The following analysis examines program incentives and savings, both MWh for electrically funded programs and MMBtu for thermally funded programs, for all residential programs, targeted low-income programs, and the two targeted programs examined in more detail for this report.
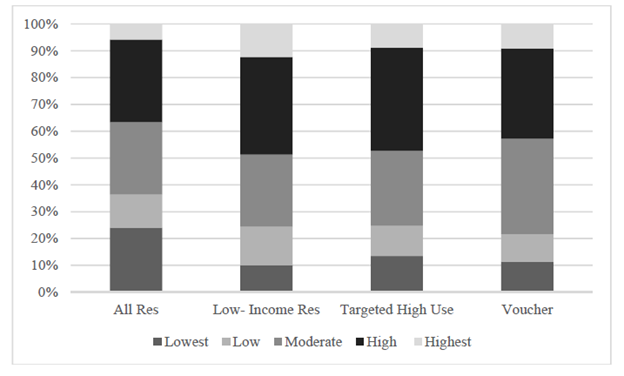
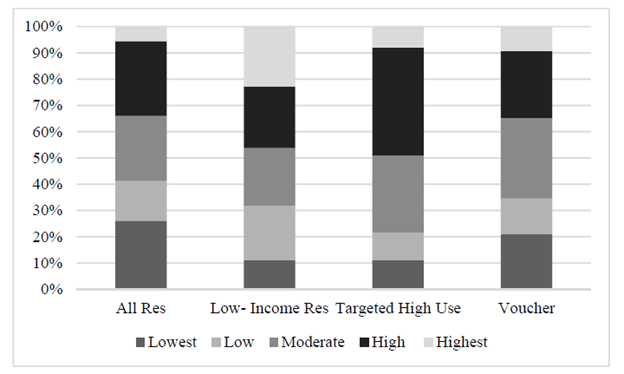
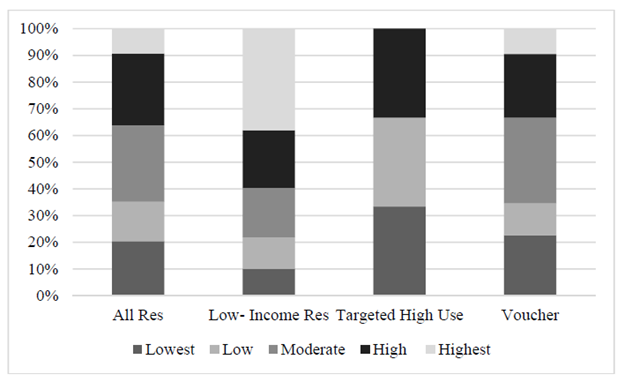
Across all residential program efforts, most program incentives are associated with program activities in Vermont towns with moderate to high energy burden, and except for total low-income programs, energy savings follow a similar trend. The finding that lower proportions of investment and savings occur for the THU and Voucher programs than other low-income program efforts bears further consideration. Efficiency Vermont is already engaged in efforts to assist these communities through updates to its Targeted Communities Program.
For 2020, four towns identified to be in the highest energy burden range have been selected for the program, which dedicates a community manager to work with local stakeholders on efforts to accelerate energy efficiency projects. Across all residential program efforts, most program incentives are associated with program activities in Vermont towns with moderate to high energy burden, and except for total low-income programs, energy savings follow a similar trend. The finding that lower proportions of investment and savings occur for the THU and Voucher programs than other low-income program efforts bears further consideration.
Efficiency Vermont is already engaged in efforts to assist these communities through updates to its Targeted Communities Program. For 2020, four towns identified to be in the highest energy burden range have been selected for the program, which dedicates a community manager to work with local stakeholders on efforts to accelerate energy efficiency projects.
Earn CEUs
Earning CEUs on the BPA Journal is a member-exclusive benefit. Please log in to complete the quiz and earn them or join as a member today.